
A Bed on Wheels: A Chinese Inventor’s Unusual Take on Personal Transportation
Facts 02/01/2026 12:02
Scientists have released the most comprehensive and detailed global map of buildings ever created, documenting an estimated 2.75 billion structures across the planet—including homes, sheds, skyscrapers, and entire megacities. Developed by researchers at the Technical University of Munich (TUM), the new interactive database represents a major breakthrough in understanding how human construction has reshaped the Earth’s surface.
The project, known as the GlobalBuildingAtlas, uses advanced artificial intelligence and machine learning techniques to analyze more than 800,000 high-resolution satellite images captured in 2019. By processing this vast amount of data, researchers were able to identify, map, and model nearly every physical structure on Earth, from isolated rural huts to dense urban landscapes.
According to the research team, the GlobalBuildingAtlas contains nearly one billion more buildings than any comparable dataset and offers up to 30 times more detail than existing global 3D models. Unlike traditional 2D maps that only show building footprints, this new tool estimates the height, volume, and spatial relationships of each structure, providing an unprecedented three-dimensional view of the built environment.
Professor Xiaoxiang Zhu, the lead author of the study and head of the dataset project at TUM, emphasized the importance of this advancement. “With 3D models, we see not only the footprint but also the volume of each building,” Zhu explained. “This enables far more precise insights into living conditions, urban density, and infrastructure development.”
The AI model behind the atlas was trained to distinguish buildings from other features such as roads, trees, and terrain. Importantly, the system relies entirely on existing satellite imagery and machine learning, eliminating the need for costly aerial surveys or ground-scanning aircraft. This approach makes the model both scalable and cost-effective, allowing it to cover the entire planet with remarkable accuracy.
Beyond its technical achievement, the GlobalBuildingAtlas is expected to have wide-ranging applications. Researchers believe it can provide valuable insights into human geography, population distribution, housing density, and wealth inequality. One key innovation introduced by the team is a new global indicator known as building volume per capita, which measures the total volume of buildings relative to population size. This metric offers a novel way to assess housing availability, infrastructure development, and social and economic disparities across regions.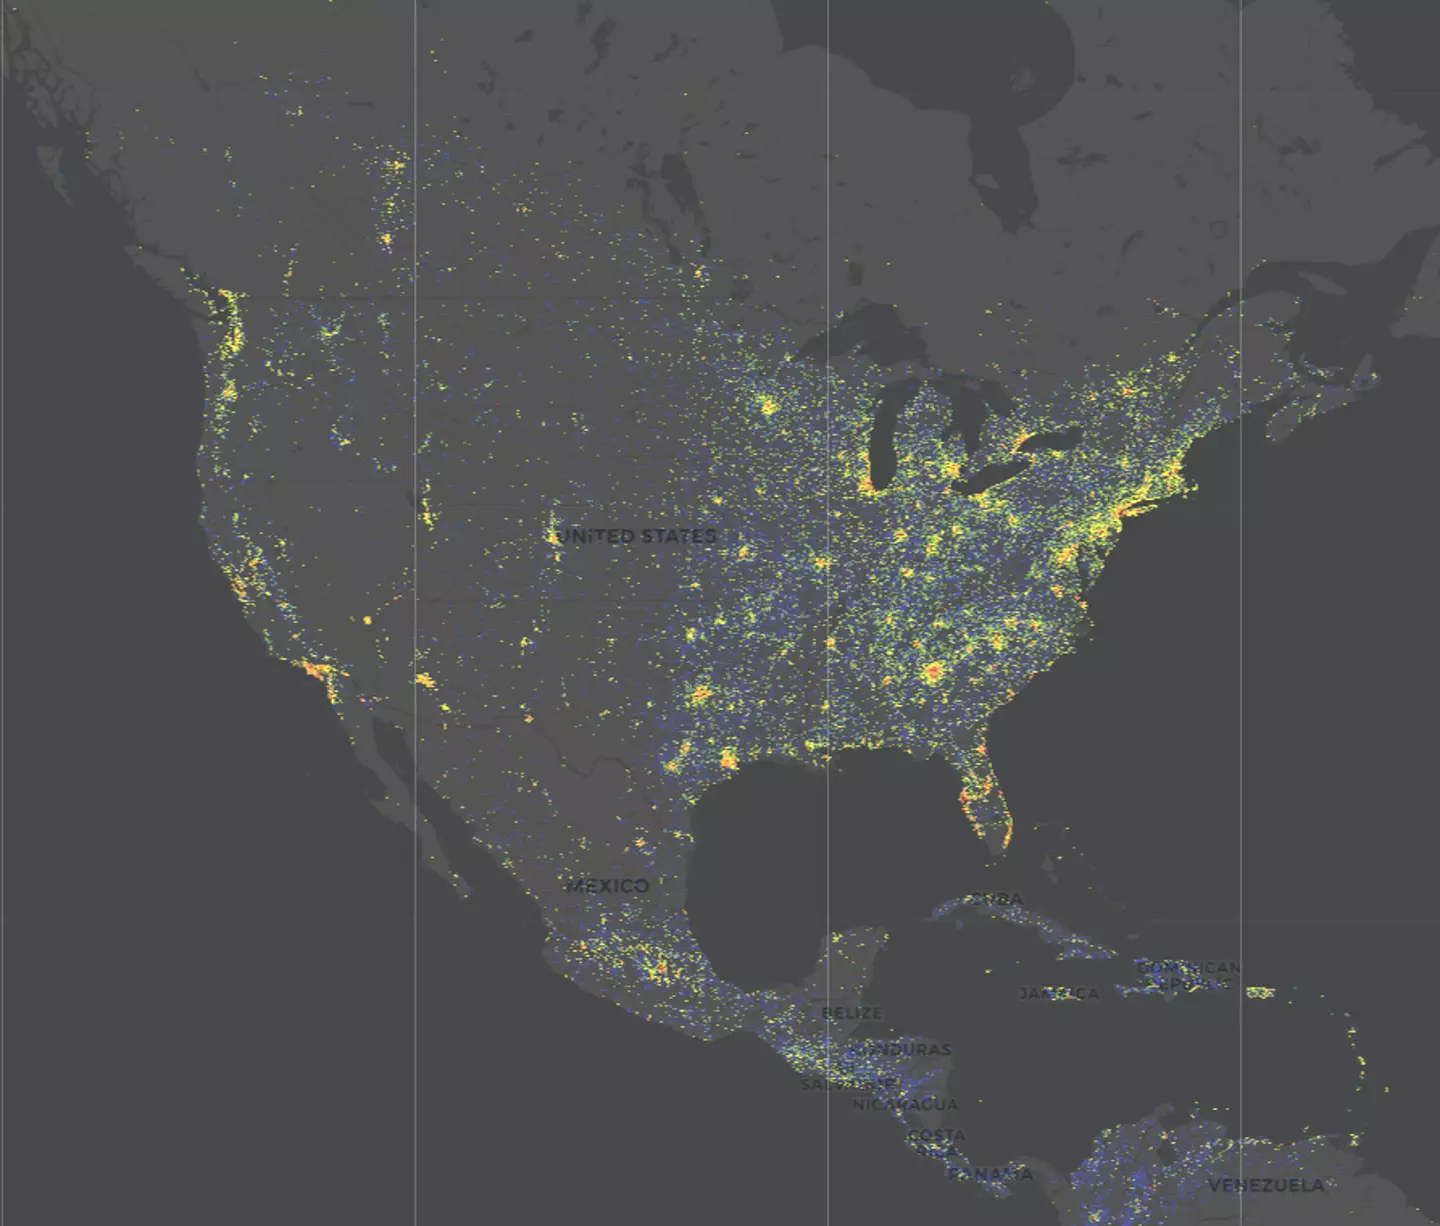
Studies have shown that wealthier areas often feature larger living spaces and more building volume per person, while poorer regions tend to have denser populations with smaller structures. By capturing these differences in three dimensions, the atlas provides a clearer and more nuanced picture of inequality than conventional mapping tools.
The researchers also highlight the atlas’s potential role in addressing global challenges such as climate change, disaster response, and sustainable urban planning. Governments and policymakers could use the data to better plan cities, manage resources, and respond more effectively to natural disasters such as floods, earthquakes, and storms by understanding building density and vulnerability at a global scale.
Since its public launch, the interactive map has attracted significant interest. In just a few days, nearly 300,000 users visited the project’s website to explore the database, reflecting strong global curiosity about how humanity has built—and continues to build—its world.
Ultimately, the GlobalBuildingAtlas marks a significant step forward in digital mapping and urban science. By revealing the full scale and structure of human construction on Earth, it offers researchers, governments, and citizens a powerful new lens through which to understand development, inequality, and the future of the planet’s built environment.
Technical University of Munich (TUM) – Official research publications and project documentation
Nature & Nature Communications – Peer-reviewed studies on global mapping and AI-driven geospatial analysis
European Space Agency (ESA) – Satellite imagery and Earth observation research
World Bank – Research on urbanization, housing density, and global inequality
United Nations Human Settlements Programme (UN-Habitat) – Reports on sustainable urban development and infrastructure